Operations automation · 2025
TA Office Hours Attendance System
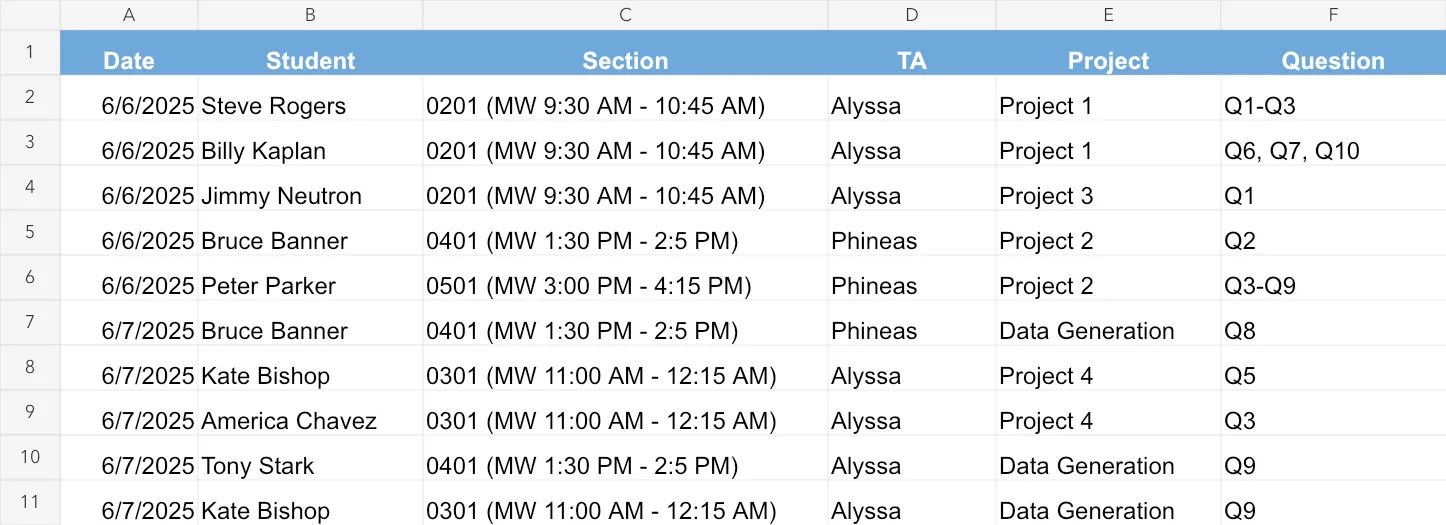
As Head TA, I built an office-hours attendance system for BMGT301 that turned everyday check-ins into a reliable view of student demand, staffing, and support.
Launched in Fall 2025. Still used across every iteration.
- 219
- Fall 2025 visits
- 99
- unique students
- 91
- visits I supported
- Role
- Head TA
- Tools
- Google Forms · Google Sheets · Apps Script
How it works
One check-in, several useful views.
I designed the workflow around what was already happening in the room. Students complete one short Form; the operational context is carried forward automatically.
- Check in The Form keeps the student step short.
Students enter their section, name, and question context to start the record.
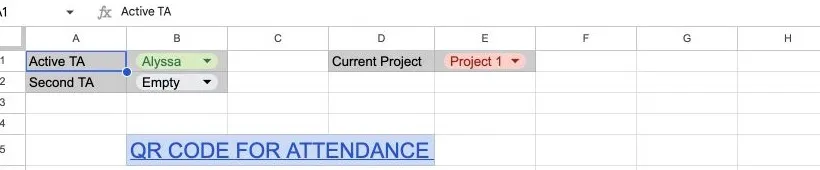
- Clock in TAs mark themselves active for the block.
Selecting the active TA, optional second TA, and current project timestamps who is covering office hours and when they arrived.
- Automate Apps Script cleans and appends each visit.
Names are normalized, timestamps are formatted, and each submission lands in the shared Attendance log.
- Learn The workbook turns visits into decisions.
TA views and statistics reveal demand by person, project, section, weekday, and visit format.
Built for active office hours
Mark yourself active. Let each visit inherit the context.
We treated selecting an active TA as clocking in for office hours. A TA chose their name, an optional second TA, and the current project at the start of the block, then cleared the selection when coverage ended. The timestamped edit log also gave us a practical way to see whether TAs arrived on time when no formal clock-in system existed.
- Tracks when a TA marks themselves active or inactive.
- Supports two TAs working the same block.
- Preserves project and question context for later analysis.
What the record revealed
Demand followed deadlines, not a tidy weekly pattern.
Fall 2025 gave the system a complete, authentic dataset: 219 visits from 99 students. The patterns were useful because each total could be traced back to the underlying attendance rows.
- Project 1 57
- Project 2 39
- Project 3 46
- Project 4 44
- Tableau 19
- Other 14
- Monday 27
- Tuesday 40
- Wednesday 53
- Thursday 74
- Friday 25
TA attributions from 219 visits
Twelve visits involved two TAs, so the staffing view preserves both contributions instead of forcing one owner per visit.
Zoom visits in the final record
Zoom was not a high-volume channel, but the commuter students who used it valued the option. The lesson was to offer it intentionally and communicate it better—not treat it as the default.
Built to outlast my role
The strongest result is that the team kept using it.
I created this version while serving as Head TA in Fall 2025. As enrollment and staffing changed, the workflow expanded beyond the original semester and passed 1,000 attendance records. The BMGT301 teaching team continues to use the system I designed.
About the evidence: the visit counts are real. Student and TA names shown in portfolio materials were replaced with fictional identities; my own name remains.
Live portfolio demo Try the live Form Expand demo
Use a fictional name and submit a test visit. Demo submissions appear in the public workbook and may be cleared periodically.
Open the demo workbook (opens in a new tab)Go deeper
Review the analysis, workbook, and source.
The page tells the story quickly. These artifacts preserve the working details for anyone who wants to inspect the system.
Mid-semester findings and recommendations
See how attendance evidence informed schedule, coverage, Zoom, and communication recommendations.
The automation behind each check-in
Read the privacy-safe source file used to normalize names, attribute visits, update the log, and maintain operational records.
- Try the live demo form Submit a fictional check-in and see how the workflow begins. (opens in a new tab)
- Explore the demo workbook Change the active TA, second TA, and project controls in a protected portfolio copy. (opens in a new tab)
- Review the historical workbook Inspect the privacy-safe Fall 2025 attendance record with fictionalized identities. (opens in a new tab)